To better understand the possible effects my daily life and external factors might have on my joint pain, I monitored 8 variables for 67 days: the highest and lowest daily temperature, humidity, hours on feet, hours outside, sickness (such as cold or flu), and knee pain in both knees.

My goal was to find a way to visualize all of this information in a way that makes it easiest to find patterns, and understand the information.
Some of my initial ideas can be seen below:
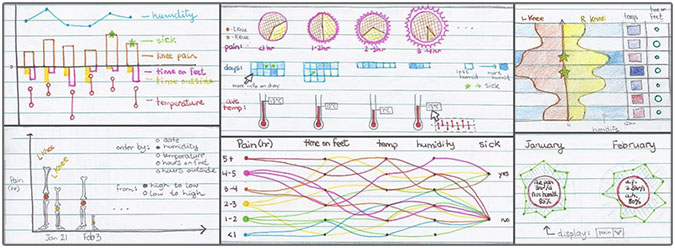
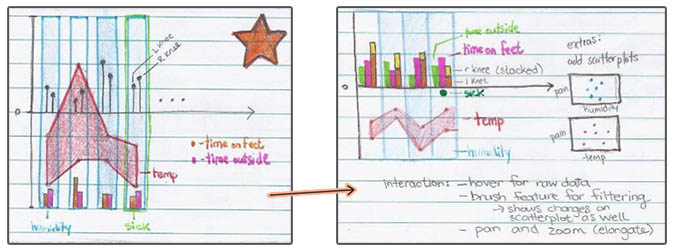
I decided on a design that shows all of the information at once without the need to filter. It used methods like coloring the bar for each day's humidity to decrease the number of values represented by the y-axis. The temperature would be shown in a continuous manner, while all other variables would be discontinuous.
As seen in the chosen design sketch below, I also wanted to add the ability to filter down to only 2 or 3 variables of interest by using scatterplots.
The final project was made in Processing, and generates data based on a provided Excel spreadsheet of data.
- Hovering over a blue rectangle in the graph shows all the variables collected for that day
- Hovering on the left side of the graph shows the y-axis values at that height
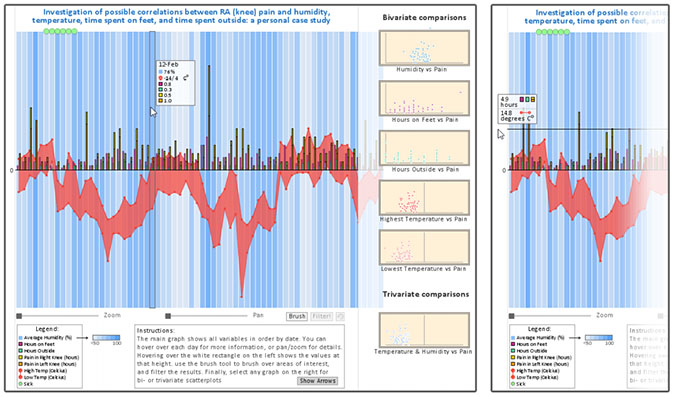
The right side of the visualization contains one trivariate and five bivariate comparisons between various variables and joint pain. Clicking on one of the scatter plots maximizes it on the screen, and lets the user mouse over each data point to see the date.
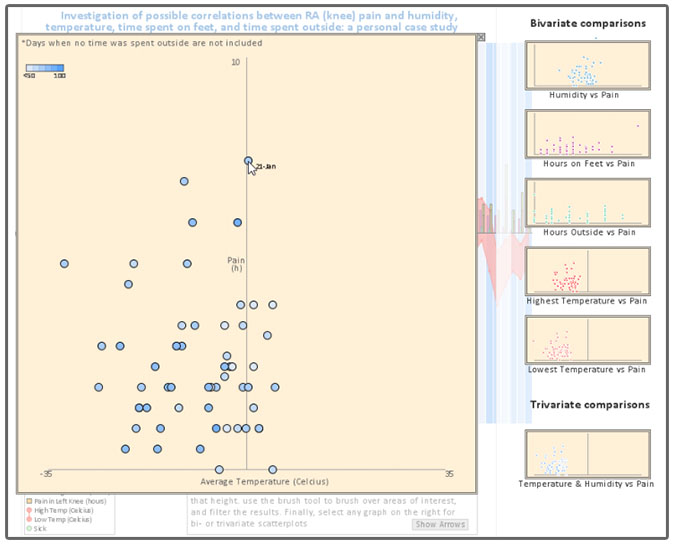
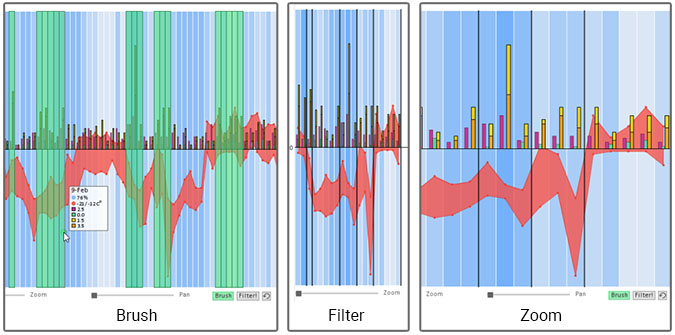
With more data points, it is important to filter by points of interest. I added a 'brush' feature that lates users brush over desired days to highlight them, then filter to view. Black lines are added between non-adjacent days to prevent finding patterns that might appear only due to data filtering.
